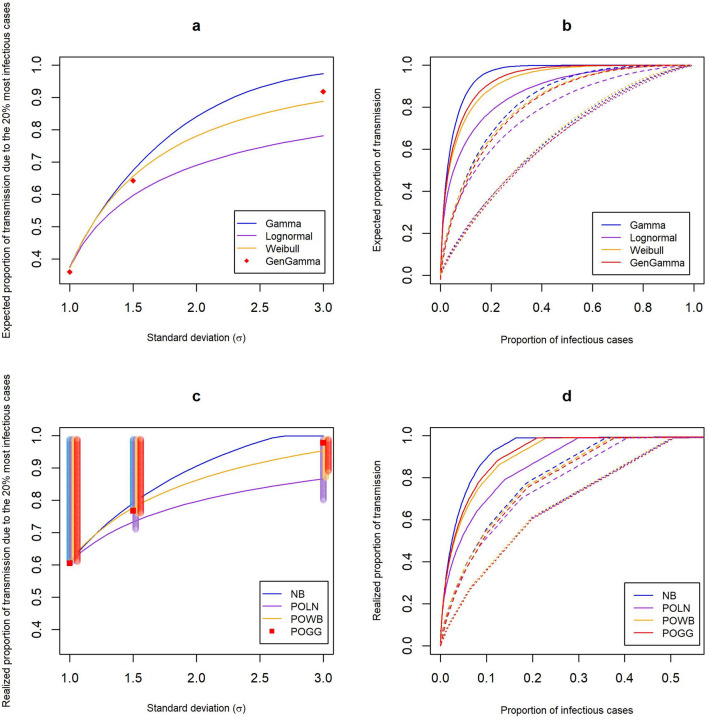
Figure 1.
The top panel shows the expected proportion of all transmission that is (a) due to the 20% most infectious cases for different levels of overdispersion and different distributions, with the offspring mean R fixed at 0.8; and (b) due to a given proportion of infectious cases, where cases are ranked by their transmission potential, for (dotted), (dashed), (full), and the different distributions, with R fixed at 0.8. The lower panel shows the realized proportion of all transmission that is (c) due to the 20% most infectious cases, shaded vertical bars show the range surrounding the proportions at (see Supplementary Methods); and (d) due to a given proportion of infectious cases.

