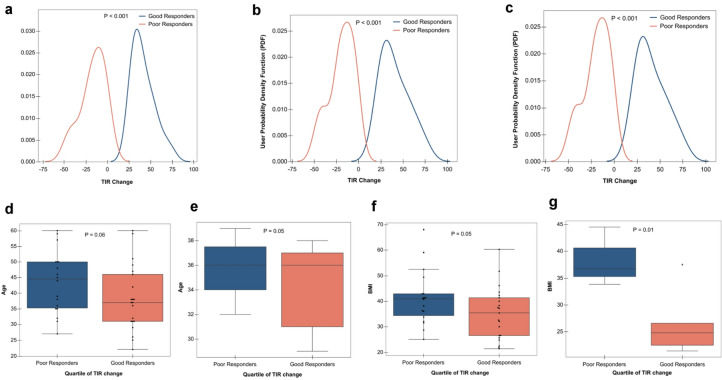
Fig. 5.
TIR responders vs non-responders. a All participant probability density function (PDF) of TIR change for good responders vs poor responders b T2D participant probability density function (PDF) of TIR change for good responders vs poor responders. c Healthy/prediabetes participant probability density function (PDF) of TIR change for good responders vs poor responders. d (All participants) Poor responders are older than good responders. e (Healthy participants) Poor responders are older than good responders. f (All participants) Poor responders have higher BMI than good responders. g (Healthy/prediabetes participants) Poor responders have higher BMI than good responders

