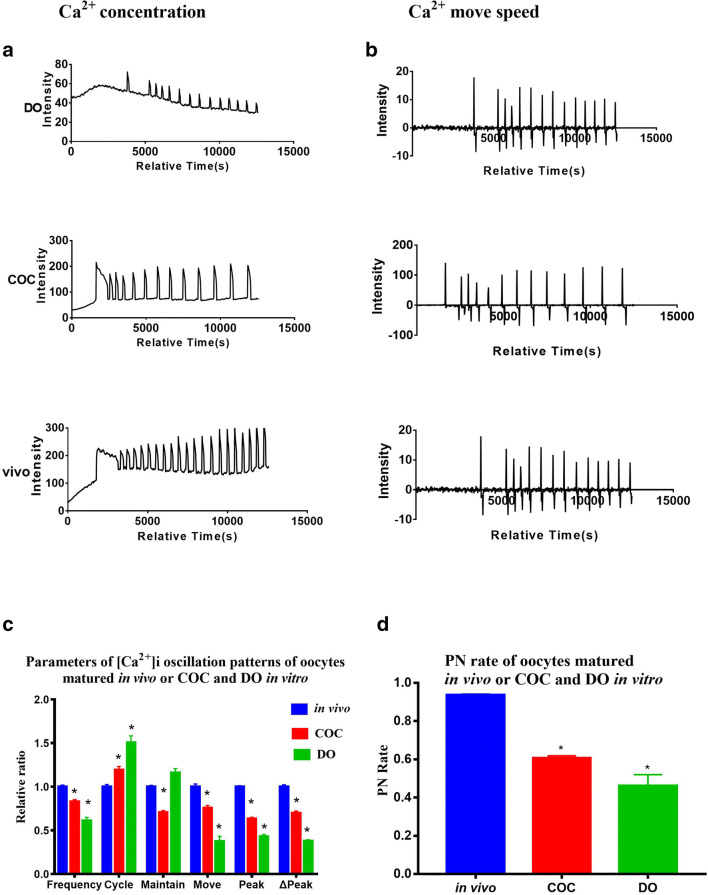
Fig. 3.
Intracellular free calcium ([Ca2+]i) oscillation patterns of in vivo oocytes and in vitro matured cumulus-denuded oocytes (DOs) and cumulus-enclosed oocyte complexes (COCs) in vitro-matured for 17 h. a, b [Ca2+]i oscillation patterns after parthenogenetic activation. c Relative [Ca2+]i oscillation parameters of oocytes matured in vivo or in vitro. The in vivo group was compared with the in vitro groups. d Pronucleus (PN) rate of in vivo and in vitro matured oocytes. N = 25 to 30 for each group. Data represent mean ± SD, and chi-square test and one-way ANOVA are used for statistical analysis. *P < 0.05 versus the control group

