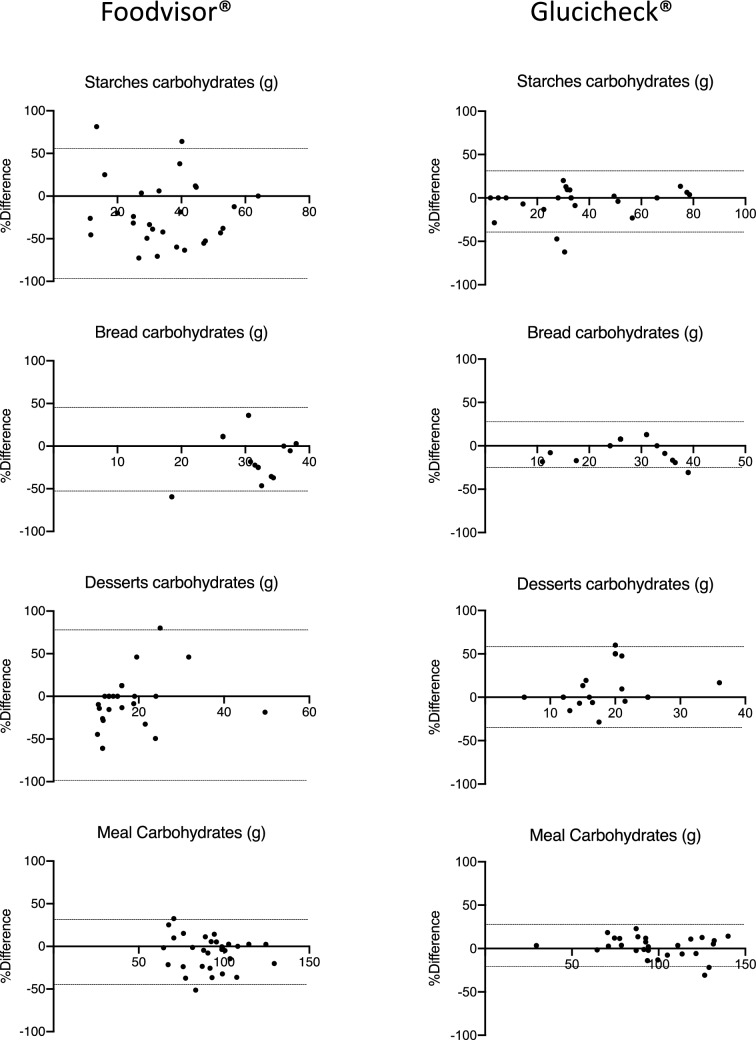
Fig. 2.
Bland–Altman representations of carbohydrate quantifications of high-carb-content courses and the entire meal obtained with Foodvisor® (left column) and Glucicheck® (right column) as compared to the corresponding reference quantifications. The average of the carbohydrate quantification obtained with an app and the corresponding reference quantification is plotted on the x-axis while the percentage difference between those quantifications (100 × (app result − reference quantification result)/average) is plotted on the y-axis. thin horizontal lines represent ± 1.96SD for each data set

