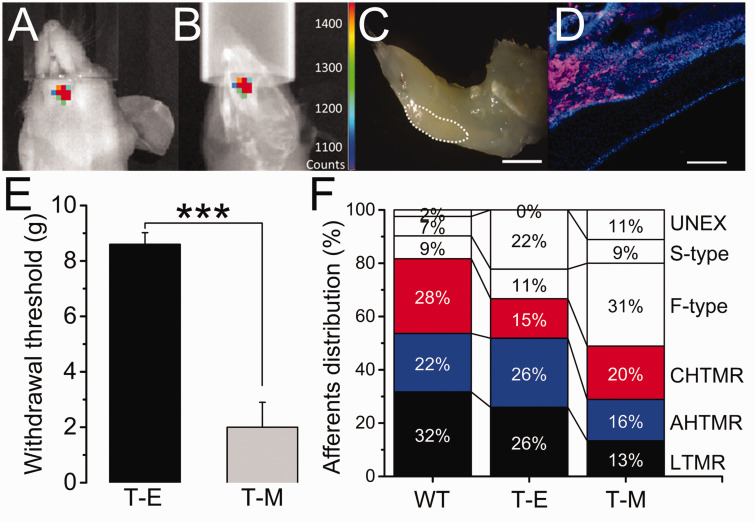
Figure 2.
Overlapped image of (a) bioluminescence and (b) X-ray of the mandible of a Foxn1 mouse 3 weeks after intracardiac injection of MDA-MB-231LUC+ cancer cells (color-coded counts, sidebar). (c) Location in the left mandible in this animal of the tumor-induced bone lesion (dotted white line). (d) Stained section of the lesion for luciferase (pink) and DAPI (blue). (e) Effects of tumor implantation on the reflexive head withdrawal (T-E vs. T-M) (***=p<0.001). (f) Distribution (in %) of TG recorded afferents per animal per treatment (WT vs. T-E vs. T-M). Scale bar: 1 mm, 100 µm.

