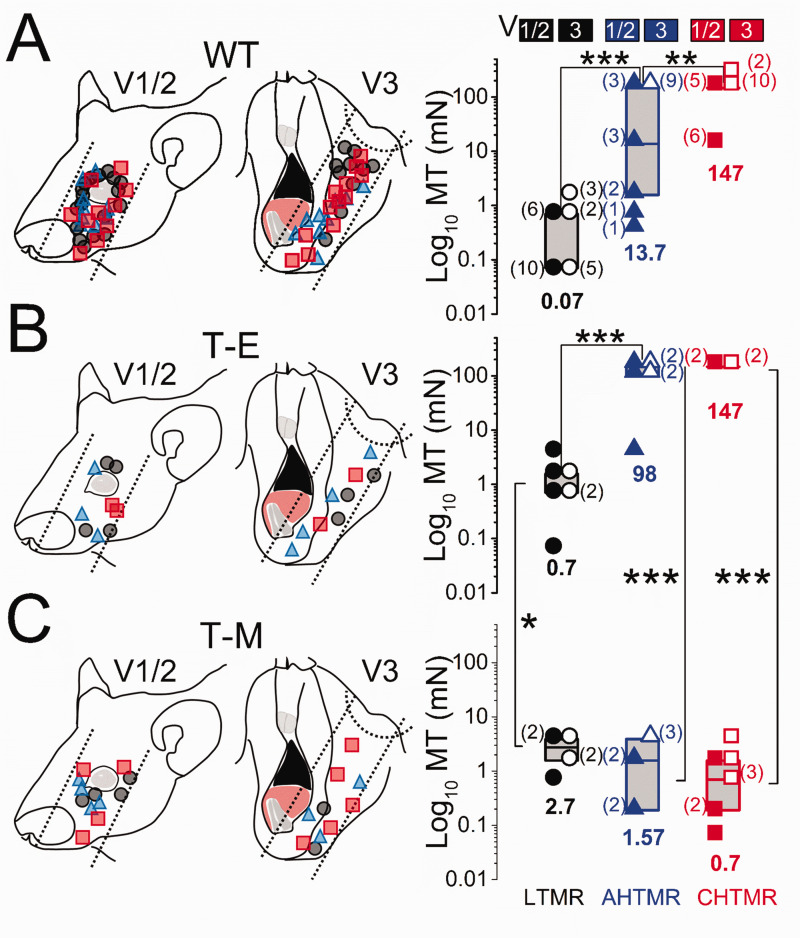
Figure 3.
Schematic diagram of the receptive field locations of recorded afferents and their presumed trigeminal nerve divisions in (a). Wild type (WT), (b) MDA-MB-231LUC+ tumor elsewhere from head and neck (T-E), and (c) MDA-MB-231LUC+ tumor in left mandible (T-M) mice. Data are presented with the location and subtype (right) (●: LTMR; ▲: AHTMR; ■: CHTMR) of recorded afferents. Mechanical threshold (MT) of subtypes of afferents according to trigeminal division: V1/V2 (solid symbol) and V3 (open symbol). Individual data points and medians (horizontal bars, values at the bottom) with boxes representing the 25 and 75 percentiles. The number of afferents per MT is presented aside in parentheses. *=p<0.05, **=p<0.01, ***=p<0.001.

