
FIGURE 4.
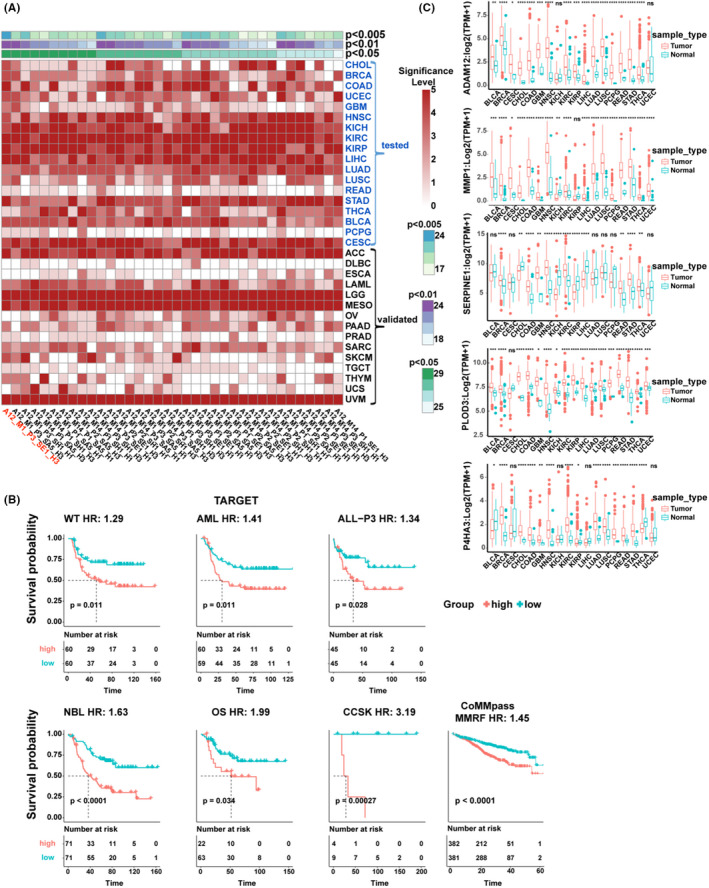
Analysis of the five regulator genes ADAM12, MMP1, SERPINE1, PLOD3, and P4HA3 in pan‐cancer. (A) Results of different signatures consisting of 11 pan‐SR‐ECM regulators from the ADAM, MMP, SERPIN, PLOD, and P4H gene families using Kaplan‐Meier survival analysis in various cancer types from TCGA. The 18 cancer types of cancer tested with another left 15 types use for validation. A: ADAM, M: MMP, S: SERPIN, P: PLOD, H: P4HA. Statistical significance is depicted as: 0: p ≥ 0.05, 1: p < 0.05, 2: p < 0.01, 3: p < 0.005, 4: p < 0.001, 5: p < 0.0001. (B) Kaplan‐Meier plot curves of the ADAM12, MMP1, SERPINE1, PLOD3 and P4HA3 five‐gene signature validated in other cancer types from other databases. The p value was calculated using the log‐rank test. HR was calculated using the Cox proportional‐hazards model based on scaled risk score. (C) Expression levels of ADAM12, MMP1, SERPINE1, PLOD3, and P4HA3 in the tumor and adjacent normal tissues across 18 cancer types. TPM: transcripts per million mapped reads. Statistical analyses were performed using the unpaired t‐test (*p < 0.05, **p < 0.01, ***p < 0.001, ****p < 0.0001)