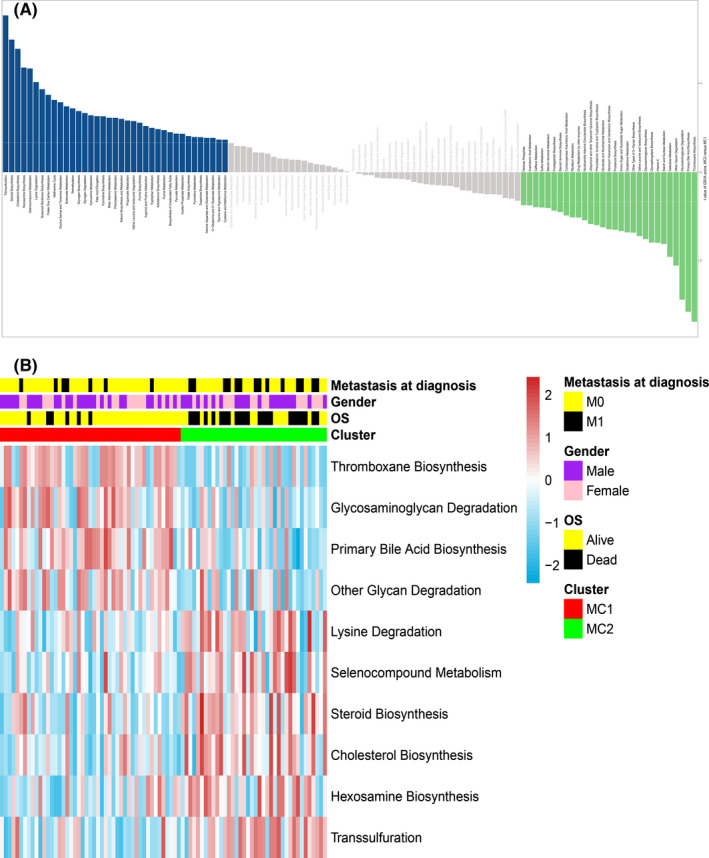
FIGURE 2.

Associations between metabolism and the osteosarcoma molecular subtypes. (A) The bar plot shows the specific metabolism‐associated signatures of the two molecular subtypes. (B) Heatmap of metabolism‐associated signatures with significant differences between the two molecular subtypes. Metastasis status, overall survival status and gender (metastasis and died, black; no metastasis and alive, yellow; male, purple; female, pink) are indicated above the heatmap
