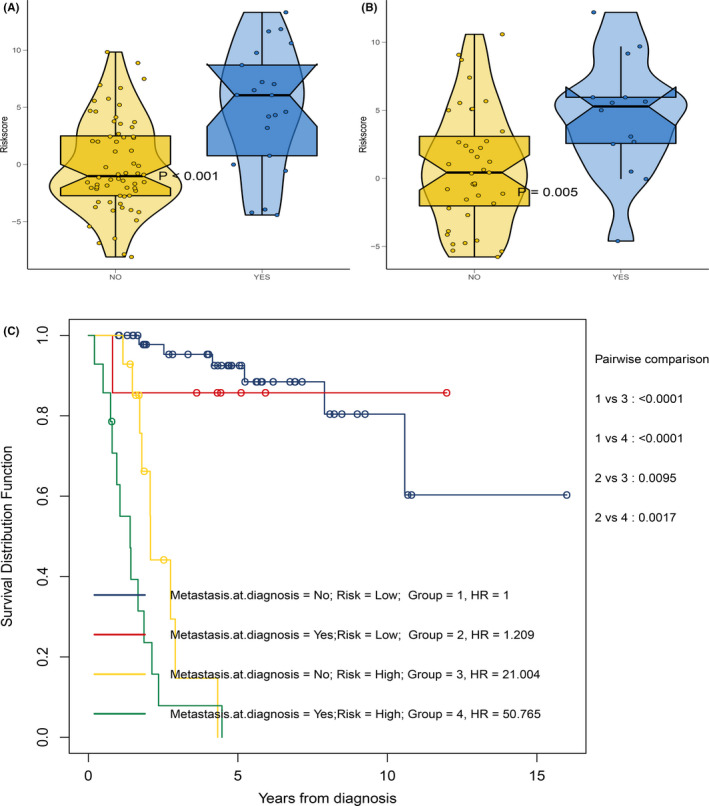
FIGURE 6.

Relationship between MRGP signature and metastasis status. (A) Box violin plot of MRGP values of patients in metastasis group and non‐metastatic group in TCGA cohort. (B) Box violin plot of MRGP values of patients in metastasis group and non‐metastatic group in GSE21257 cohort. (C) Kaplan–Meier survival curves of overall survival for osteosarcoma patients in subgroups stratified by both MRGP groups and metastasis status
