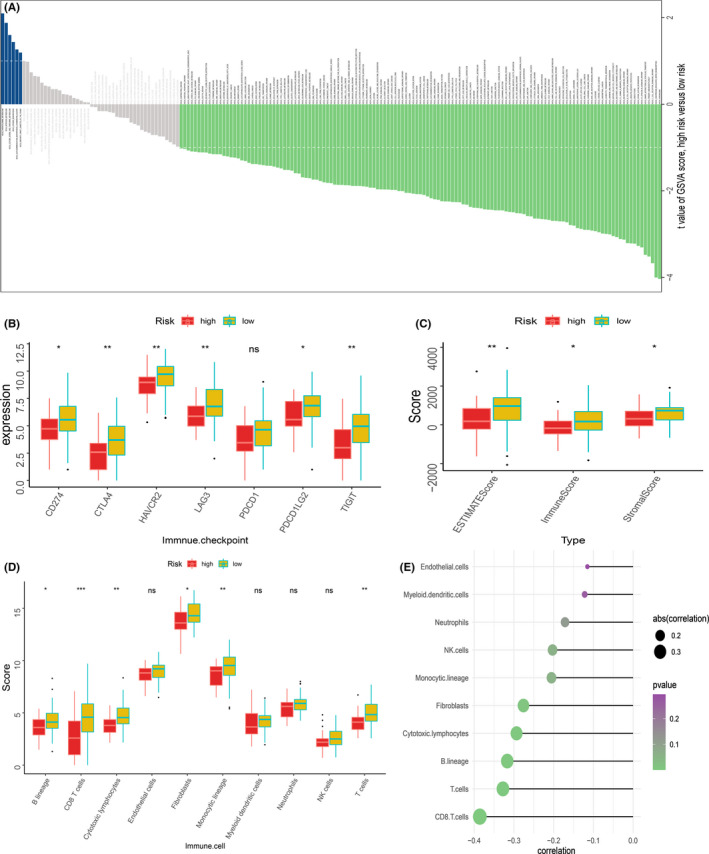
FIGURE 8.

Difference of immune infiltration among patients in MRGP signature group. (A) The bar plot shows the specific metabolism‐associated signatures of the two molecular subtypes. (B) Box plot showing the expression of 7 immune checkpoint genes in two groups of patients. (C) The box plot shows the immune score, stromal score and ESTIMATE score of the two groups of patients. (D) Box plot showing the absolute abundance scores of 8 immune cell and 2 stromal cell populations in two groups of patients. (E) Correlation matrix between absolute abundance scores of immune cells and stromal cells and MRGP values. The size of the bubble represents the degree of correlation, and the colour of the bubble represents the p‐value of the correlation. (ns represents no significance, *p < 0.05, **p < 0.01, ***p < 0.001)
