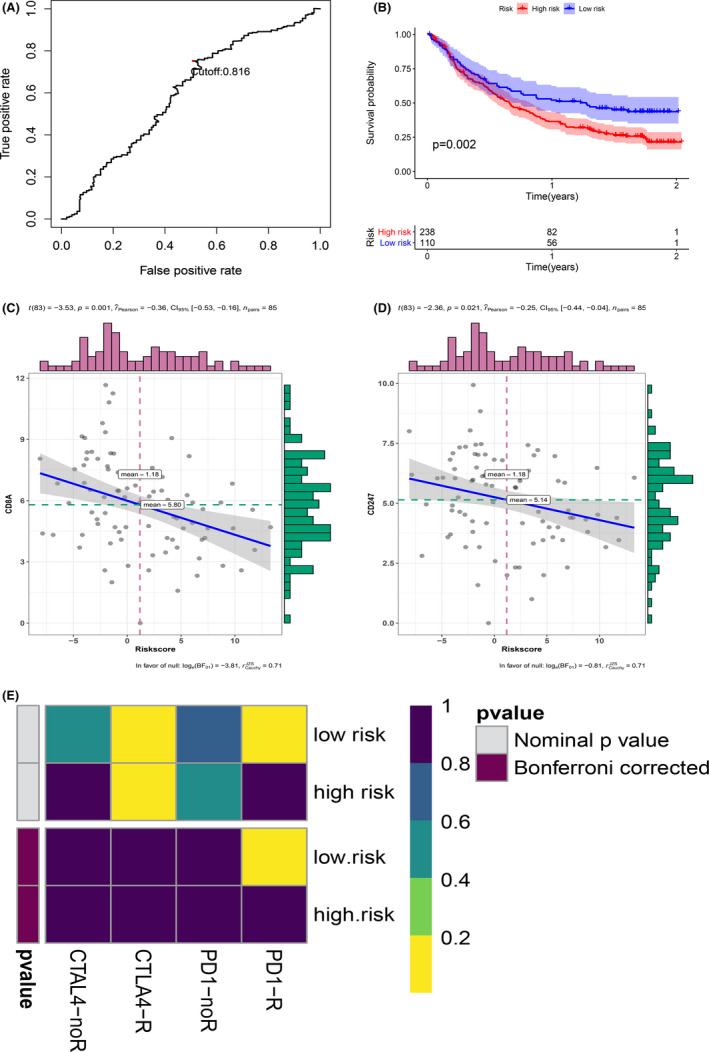
FIGURE 9.

Relationship between MRGP signature and immunotherapy efficiency. (A) ROC curve and cut‐off value according to the overall survival rate of the MRGP group in the IMvigor210 cohort. (B) Kaplan–Meier curves of overall survival according to MRGP groups in the IMvigor210 cohort. (C) Correlation between MRGP value and CD8A gene expression. (D) Correlation between MRGP value and CD247 gene expression. (E) Heatmap of correlation between expression profiles of patients in the MRGP group and patients receiving immunotherapy. The colour of the grid represents the correlation P‐value
