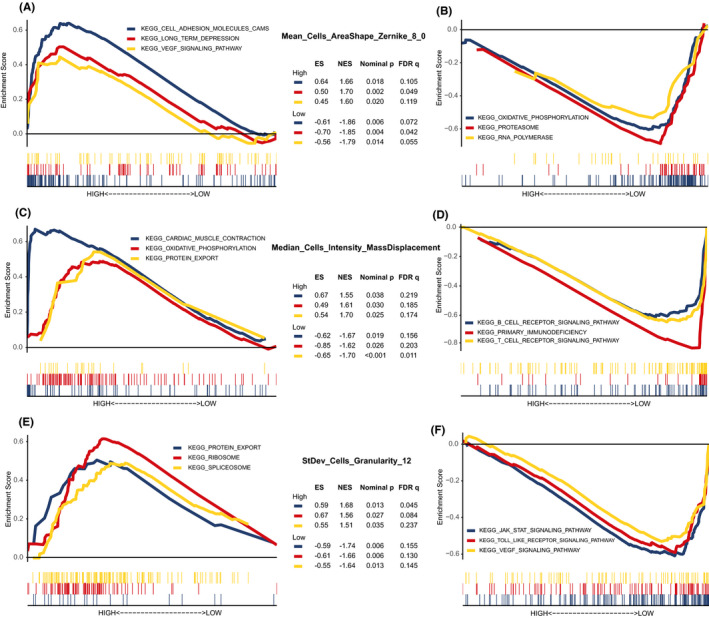
FIGURE 3.

The enriched signaling pathways analyzed by gene set enrichment analysis in the training set. (A,B) Three representative pathways in groups with higher or lower Mean_Cells_AreaShape_Zernike_8_0. (C,D) Three representative pathways enriched in patients with high‐value or low‐value Median_Cells_Intensity_MassDisplacement. (E,F) Three representative pathways in high‐ or low‐StDev_Cells_Granularity_12 groups. ES, enrichment score; NES, normalized enrichment score; FDR, false discovery rate
