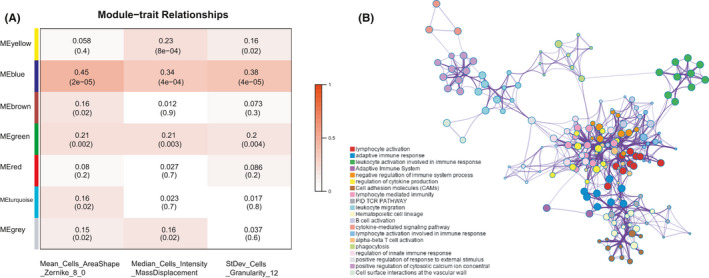
FIGURE 4.

Identification and enrichment analysis of correlated gene modules in the training set. (A) Relationships between module eigengenes and histopathological image features. The blue module was most significant. (B) Enrichment network of blue module genes by Metascape. A circle node represented a term, its size depended on the number of input genes, and node color reflected the cluster identity. The most significantly enriched term was used to describe each cluster (see legend on left)
