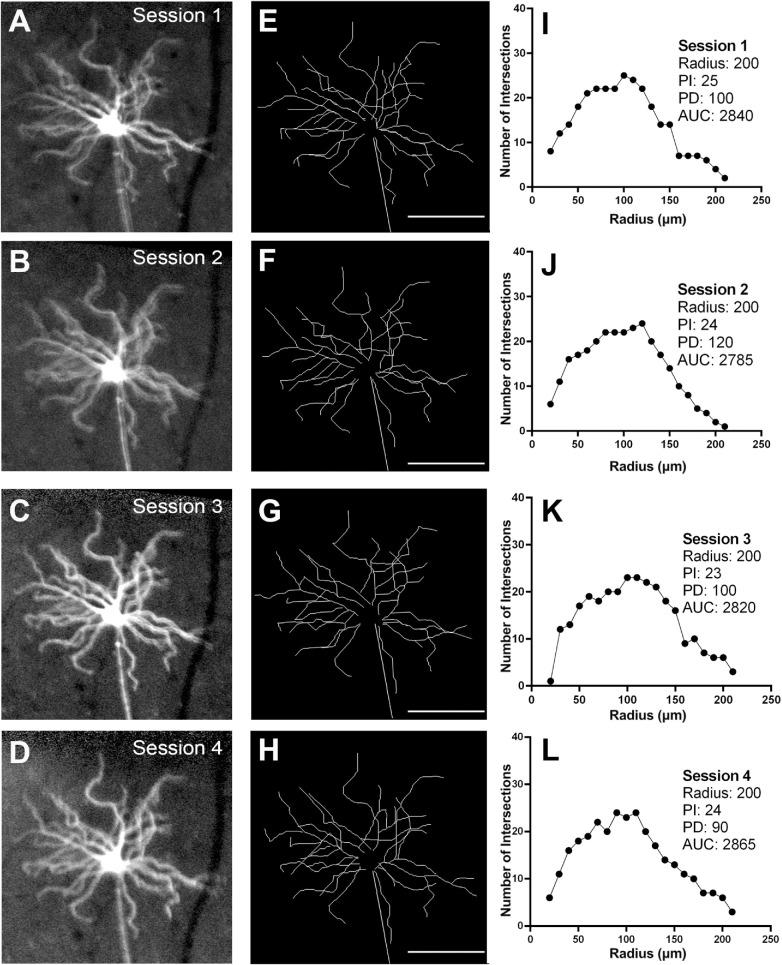
Figure 1.
Longitudinal in vivo imaging of a Thy1-YFP transgenic mouse in the control group imaged weekly over four weeks to quantify the variability of parameters derived with Sholl analysis. Following in vivo imaging, YFP-positive cells were traced and Sholl profiles derived. Magnified view of one RGC the over the four imaging sessions (A–D), corresponding traces (E–H), and Sholl profiles (I–L). PI, peak number of intersections; PD, distance to the peak number of intersections; radius; AUC, area under the curve. Scale bar: 100 µm.

