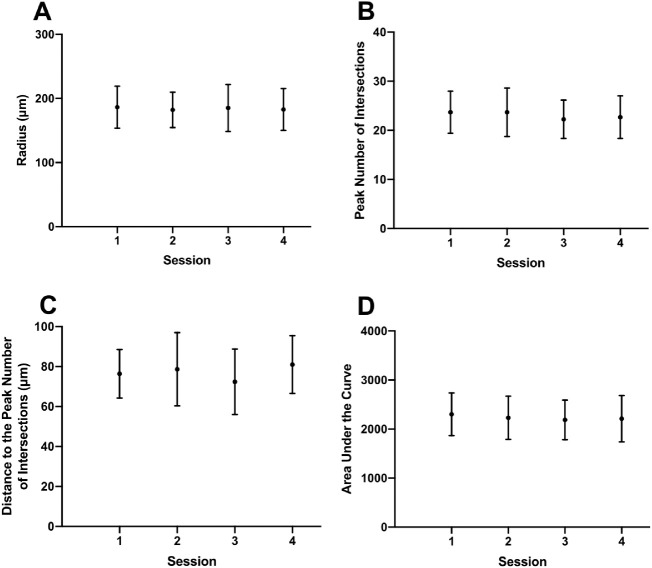
Figure 2.
Longitudinal changes in radius (A), peak number of intersections (B), distance to the peak number of intersections (C), and area under the curve (D) for the RGCs analyzed in the control group over four imaging sessions. Dots represent means and the error bars represent one standard deviation on either side of the mean.

