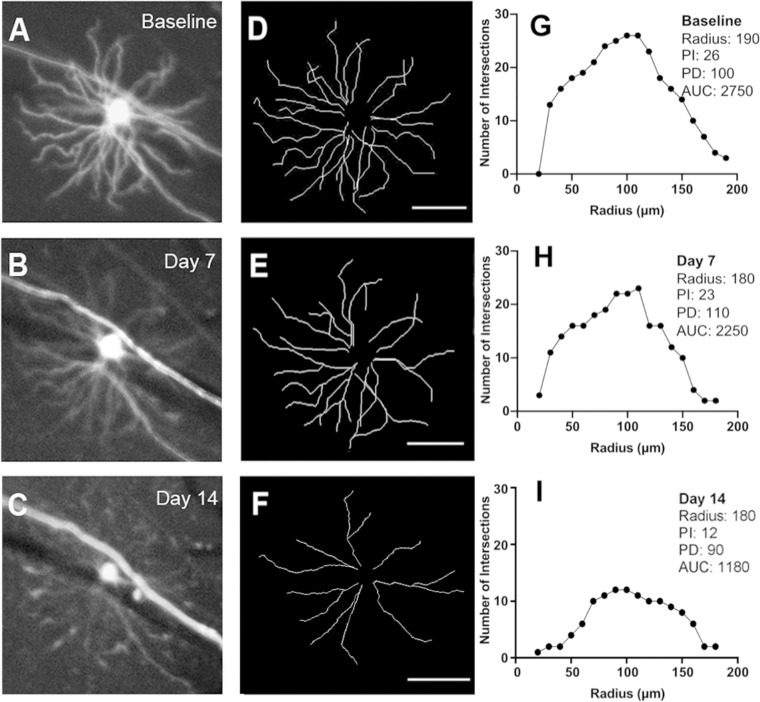
Figure 3.
Longitudinal in vivo imaging of a Thy1-YFP transgenic mouse in the optic nerve transection (ONT) group. Magnified view of one RGC at baseline (A) and at seven (B) and 14 (C) days after ONT. Corresponding traces (D–F) and Sholl profiles (G–I). PI, peak number of intersections; PD, distance to the peak number of intersections; AUC, area under the curve. Scale bar: 100 µm.

