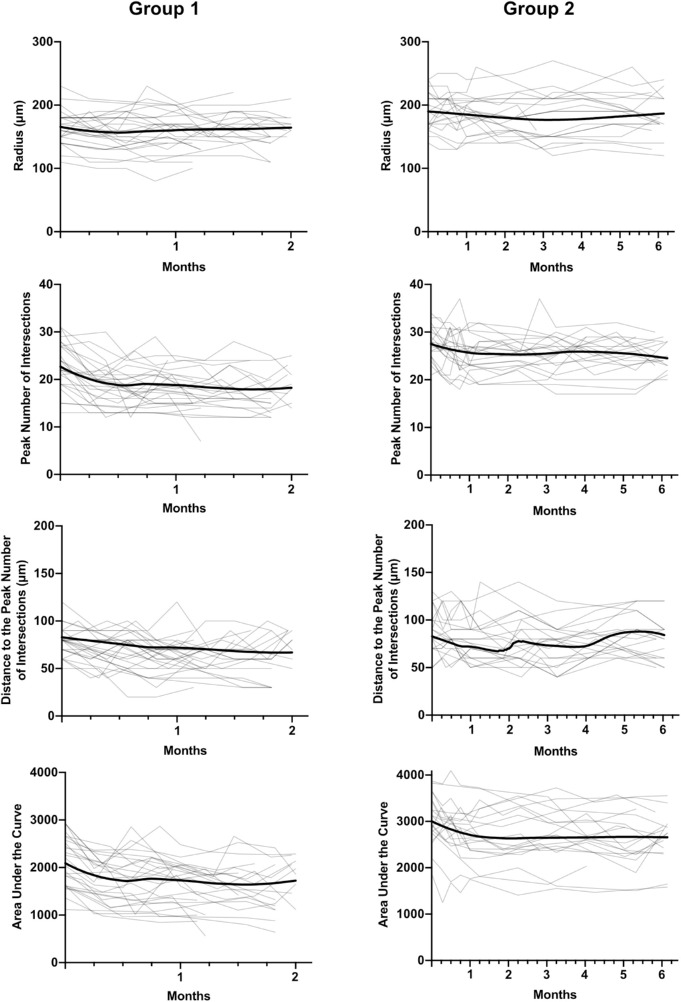
Figure 7.
Longitudinal changes in radius, peak number of intersections, distance to the peak number of intersections, and area under the curve for all RGCs analyzed in the group 1 and group 2 experimental glaucoma groups (EG, light lines). Each gray trace represents data from one retinal ganglion cell while the bold trace represents the mean time course computed by local regression (LOESS fit).

