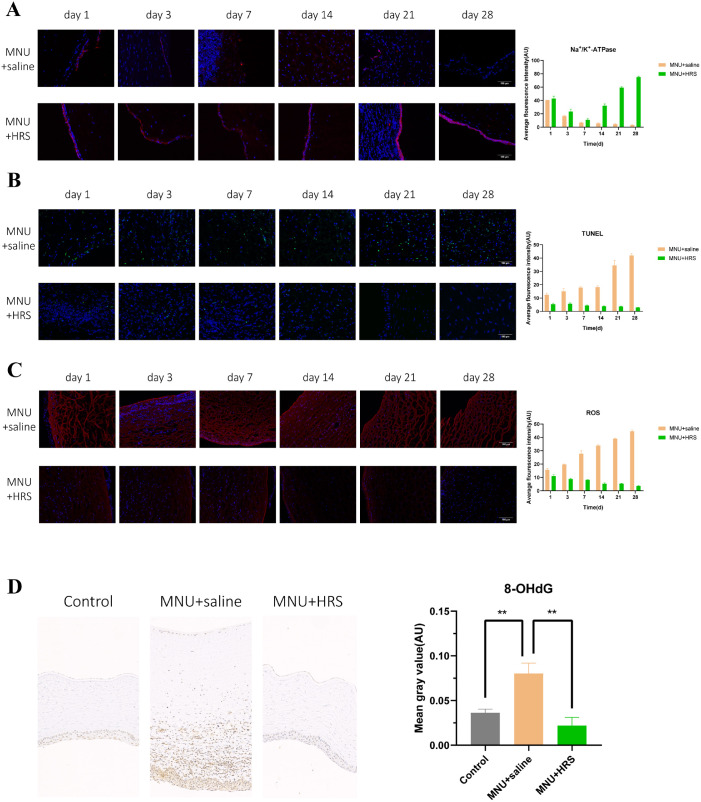
Figure 6.
Detection of indexes of rabbit corneas. (A) The immunofluorescence expression of Na+/K+-ATPase showed a statistically significant difference between the MNU + saline group and the MNU + HRS group. During the whole follow-up period, the immunofluorescence expression of Na+/K+-ATPase of the corneal endothelium in the MNU + saline group gradually decreased and became negative at day 28, whereas the expression in the MNU + HRS group decreased significantly from day 1 to day 14, but increased at day 21 and day 28. The difference was statistically significant between the MNU + saline group and the MNU + HRS group (P < 0.0001). In every observation window except day 1, the expression of Na+/K+-ATPase in the MNU + HRS group was higher than that in the MNU + saline group, with a statistically significant difference (day 1: P = 0.3444; day 3: P < 0.05; day 7: P < 0.05; day 14: P < 0.0001; day 21: P < 0.0001; and day 28: P < 0.0001; red: Na+/K+-ATPase; blue: DAPI). Scale bar = 100 µm. (B) TUNEL staining of rabbit corneas. TUNEL staining showed that a large number of apoptotic cells were found in all layers of the cornea in the MNU + saline group at day 21 and day 28. The apoptosis in the MNU + HRS group was significantly slighter than that in the MNU + saline group, and the difference was statistically significant (P < 0.0001, n = 18). There were significant differences between the two groups at each time point, suggesting that HRS could significantly reduce MNU-induced CEC apoptosis (day 1: P < 0.01; day 3: P < 0.01; day 7: P < 0.0001; day 14: P < 0.0001; day 21: P < 0.001; and day 28: P < 0.0001; green: apoptosis; blue: DAPI). Scale bar = 100 µm. (C) ROS staining of rabbit corneas. ROS immunofluorescence staining images showed the expression of ROS in various layers of the cornea, suggesting that the effect of MNU on ROS became stronger and stronger with the passage of time, whereas HRS suspended or even reversed MNU's induction of ROS (P < 0.0001, n = 18). There were significant differences between the MNU + saline group and the MNU + HRS group at each time point (day 1: P < 0.01; day 3: P < 0.0001; day 7: P < 0.001; day 14: P < 0.0001; day 21: P < 0.0001; and day 28: P < 0.0001). Scale bar = 100 µm. (D) Immunohistochemical assay was used to detect the expression of 8-OHdG in the cornea of New Zealand rabbits at day 28. The expression of 8-OHdG in the MNU + saline group was significantly higher than that in the control group (P < 0.01), and the expression of 8-OHdG in the MNU + HRS group was significantly lower than that in the MNU + saline group (P < 0.01).

