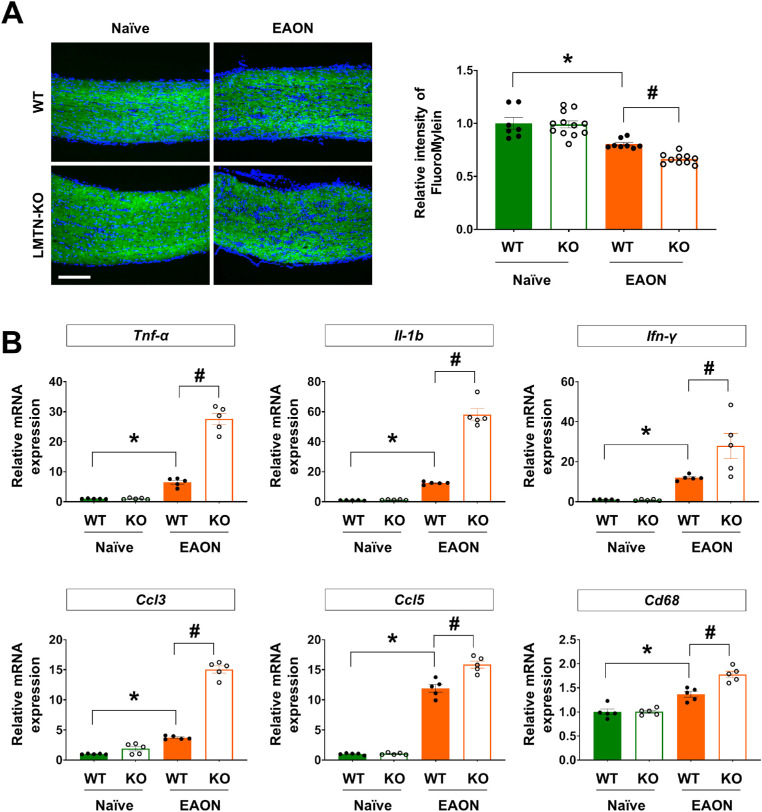
Figure 2.
Limitrin deficiency accelerates EAON pathology. (A) Myelin of the optic nerve was visualized by FluoroMyelin staining in naïve (WT, n = 7; LMTN-KO, n = 12) and EAON-induced (WT, n = 8; LMTN-KO, n = 10) mice at 17 days after immunization. Scale bar = 200 µm. (Right panel) Quantified data of demyelination in naïve or EAON-induced WT and LMTN-KO mice. Quantification of myelin was performed by measuring the fluorescence intensity using the Fiji software. The value represents the fold-change compared with naïve WT control mice. (B) Expression of cytokines and chemokines in the optic nerves of naïve (WT, n = 5; LMTN-KO, n = 5) and EAON-induced (WT, n = 5; LMTN-KO, n = 5) mice at 17 days after immunization. Data are expressed as mean ± SEM. Mann–Whitney U test. *P < 0.05 versus WT mice; #P < 0.05 versus EAON-induced mice. LMTN, limitrin.

