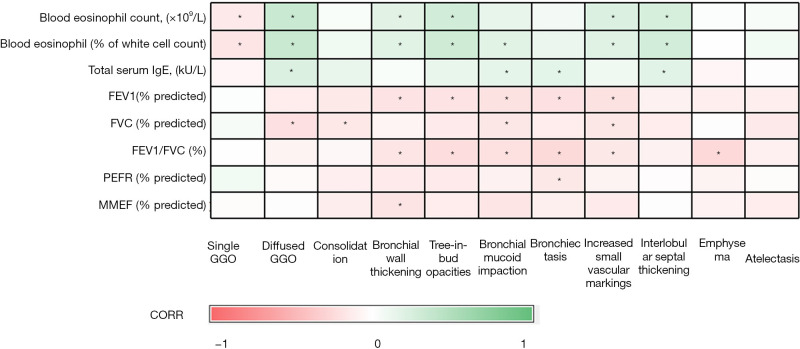
Figure 3.
Correlations between imaging findings and clinical characteristics and lung function are shown on this heat map. Green is associated with a positive correlation while red is associated with the negative correlation. The darker the color, the stronger relationship (*, P<0.05). GGO, ground-glass opacity; IgE, immunoglobulin E; FEV1, forced expiratory volume in the first second; FVC, forced vital capacity; PEFR, peak expiratory flow rate; MMEF, mid-maximal expiratory flow.

