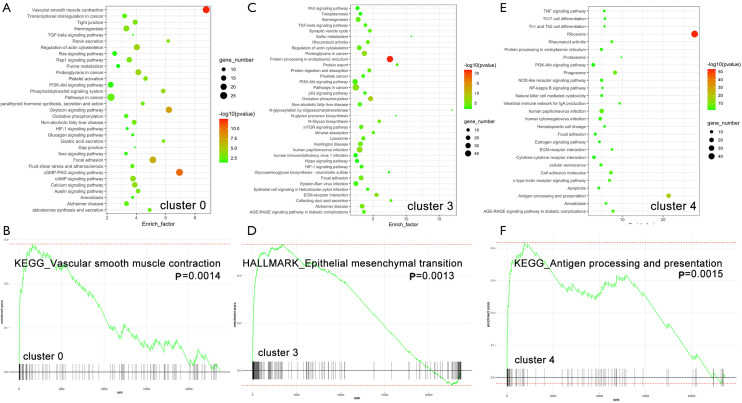
Figure 5.
Functional enrichment analysis for cancer-associated fibroblasts (CAFs) subclusters. (A) Bubble chart of Kyoto Encyclopedia of Genes and Genomes (KEGG) pathway analysis for cluster 0 CAFs; (B) the single-sample gene set enrichment analysis (ssGSEA) of cluster 0 CAFs; (C) Bubble chart of KEGG pathway analysis for cluster 3 CAFs; (D) The ssGSEA of cluster 3 CAFs; (E) Bubble chart of KEGG pathway analysis for cluster 4 CAFs; (F) the ssGSEA of cluster 4 CAFs.

