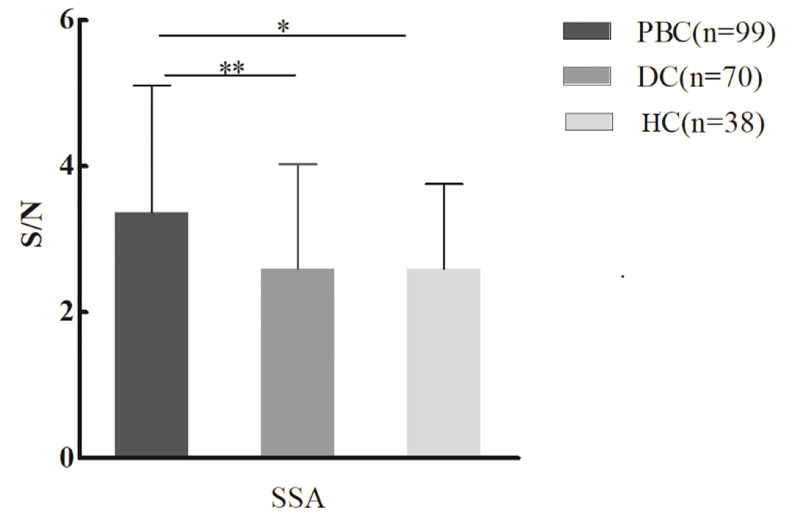
Figure 1.
Specific changes of serum IgG glycosylation in PBC patients’ comparison with DCs and HCs from the lectin microarray. *P < 0.05. PBC, primary biliary cholangitis; DC, disease control; HC, healthy controls; SSA, Salvia sclarea. S/N, the medium intensity of the spot foreground relative to the background. **p < 0.01.

