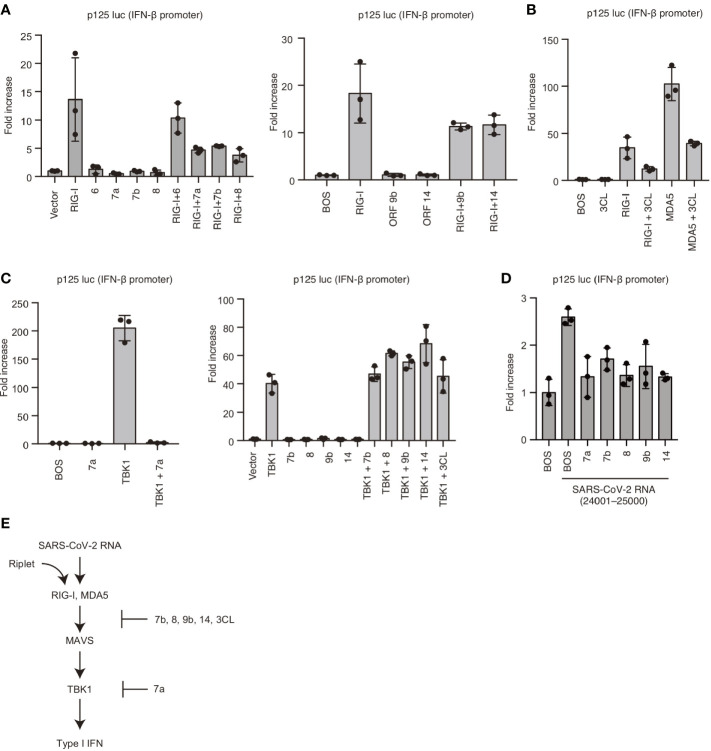
Figure 5.
Viral proteins attenuated RIG-I-mediated signaling. (A) RIG-I, viral ORF 6, 7a, 7b, 8, 9b, and 14 expressing vectors were transfected into HEK293 cells with p125 luc plasmid for 24 h, and the luciferase activities were determined. The data represent the mean ± SD (n = 3). The data shown is representative of three independent experiments. (B) RIG-I, MDA5, and viral 3CL protein expressing vectors were transfected into HEK293 cells together with p125 luc plasmid for 24h, and the luciferase activities were determined. The data represent the mean ± SD (n = 3). The data shown is representative of three independent experiments. (C) TBK1, viral ORF 7a, 7b, 8, 9b, 14, and 3CL expressing vectors were transfected into HEK293 cells together with p125 luc plasmid for 24 h, and the luciferase activities were determined. The data represent the mean ± SD (n = 3). The data shown is representative of three independent experiments. (D) HEK293 cells were transfected with viral ORF 7a, 7b, 8, 9b, or 14 expressing vectors together with p125luc plasmid. Twenty-four hours after transfection, cells were then stimulated with the viral fragment trasnfection containing 24001–25000, then luciferase activities were determined. The data represent the mean ± SD (n = 3). The data shown is representative of three independent experiments. (E) Schematic representation of the cytoplasmic type I IFN expression pathway and viral protein-mediated suppression. The data shown is representative of three independent experiments.

