
FIGURE 15.
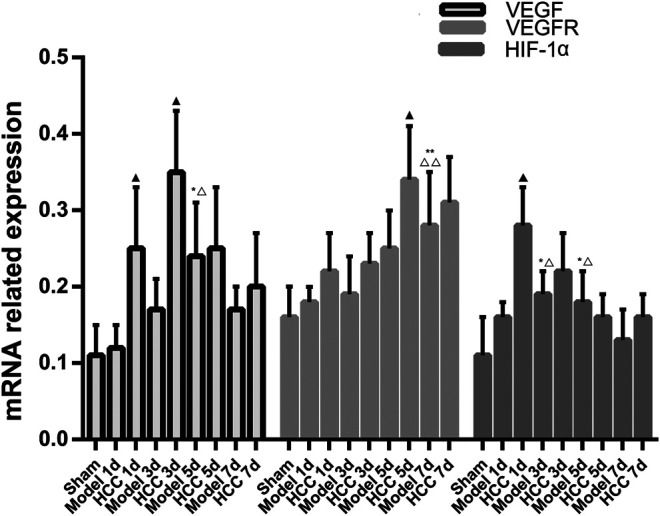
The Expression of VEGF, VEGFR and HIF-1α proteins (compared with the normal group, *p < 0.05, **p < 0.01; compared with the Sham operation group, △p < 0.05, △△p < 0.01; compared with CIR group ▲p < 0.05).
Official websites use .gov
A
.gov website belongs to an official
government organization in the United States.
Secure .gov websites use HTTPS
A lock (
) or https:// means you've safely
connected to the .gov website. Share sensitive
information only on official, secure websites.
The Expression of VEGF, VEGFR and HIF-1α proteins (compared with the normal group, *p < 0.05, **p < 0.01; compared with the Sham operation group, △p < 0.05, △△p < 0.01; compared with CIR group ▲p < 0.05).