Figure 3.
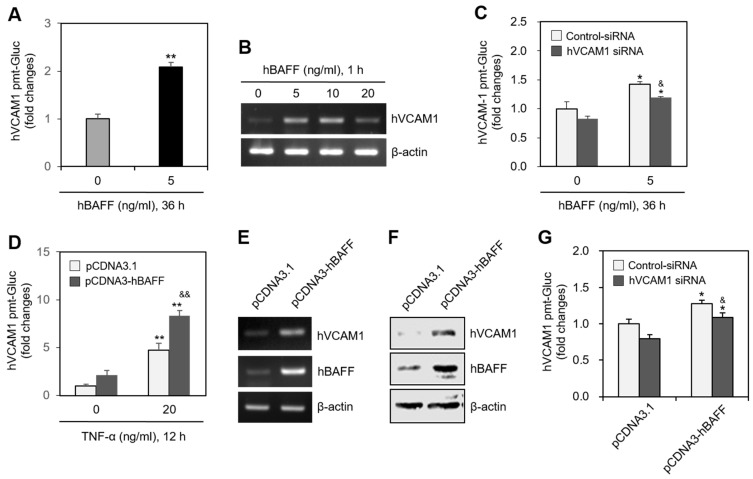
Human vascular cell adhesion molecule-1 (hVCAM1) expression was up-regulated by the treatment or the overexpression of hBAFF. (A) MH7A cells were transfected with pEZx-PG02-hVCAM1-gaussia luciferase (Gluc) plasmid DNA by using polyethylenimine (PEI), and treated with 5 ng/mL hBAFF protein. Gluc activity was measured by using luminometer. (B) MH7A cells were treated with various concentrations of hBAFF protein. RNA was purified with Nucleozol®. hVCAM1 expression was detected by RT-PCR. (C) MH7A cells were transfected with control or hVCAM1-siRNA to knockdown hVCAM1 expression by using Lipofectamine®. Then, cells were transfected with pEZx-PG02-hVCAM1-Gluc plasmid DNA by using PEI and treated with 5 ng/mL hBAFF protein. Gluc activity was measured by using luminometer. (D–F) MH7A cells were co-transfected with pCDNA3.1, or pCDNA3-hBAFF and pEZx-PG02-hVCAM1-Gluc plasmids by using PEI. Gluc activity was measured by using luminometer (D). RNA was purified with Nucleozol®. hVCAM1 expression was detected by RT-PCR (E). Cell lysates were prepared and hVCAM1 protein level was detected by western blot analysis (F). (G) MH7A cells were transfected with control or hVCAM1-siRNA to knockdown hVCAM1 expression by using Lipofectamine®. Then, cells were co-transfected with pCDNA3.1, or pCDNA3-hBAFF and pEZx-PG02-hVCAM1-Gluc plasmid DNA by using PEI. Gluc activity was measured by using luminometer. Each experiment was performed at least four times. Data in a bar graph represent the means ± SD. * p < 0.05, ** p < 0.01; significantly different from hBAFF protein-untreated (A,C) or pCDNA3.1-treated and TNF-α-untreated (D,G) or control group. & p < 0.05, && p < 0.01; significantly different from control-siRNA-treated and hBAFF protein-treated (C) or pCDNA3.1-transfected and TNF-α-treated (D) or control-siRNA-treated and pCDNA3.1-hBAFF-transfected (G) control group.

