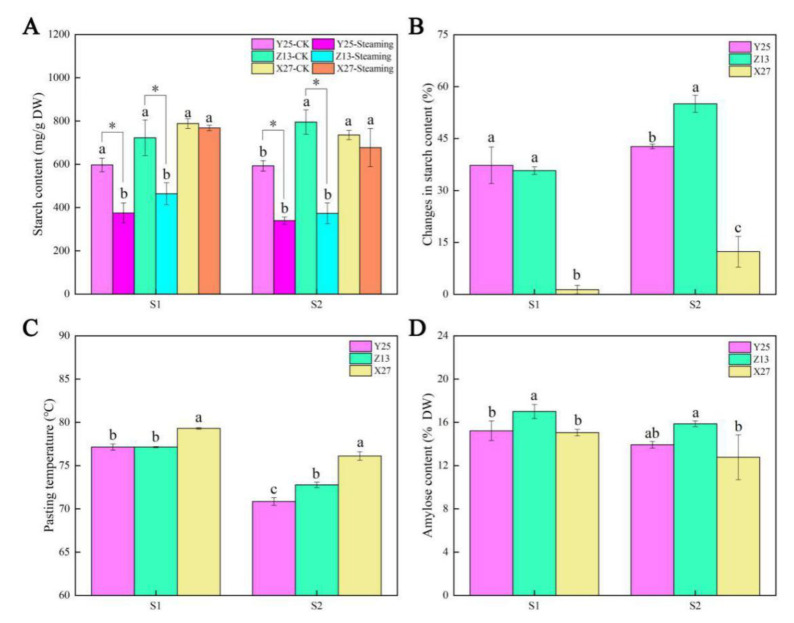
Figure 3.
(A) Starch content, amylopectin content, and gelatinization temperature of the samples at 90 d and 130 d; (B) The changes of starch content in sweetpotato before and after steaming; (C) Changes in gelatinization temperature of sweetpotato starch; (D) Amylose content of sweetpotato. The SE of three biological repetitions is shown as an error bar. Bars not sharing a common letter differ (p < 0.05) by one-way ANOVA and Tukey’s multiple comparison test. Asterisks indicate statistical differences between CK and steaming values (p < 0.05, Student’s t-test).

