Figure 6.
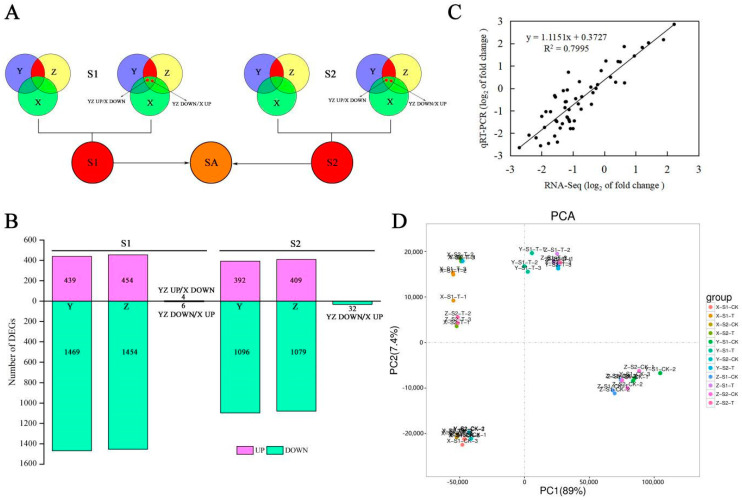
Statistics and verification of DEGs in transcriptome and principal component analysis (PCA) of samples. (A) Analysis strategy of transcriptome data. (B) Statistics of the number of DEGs in two growth stages. (C) Correlation analysis of transcriptome and qRT-PCR data. (D) PCA of transcriptome samples.

