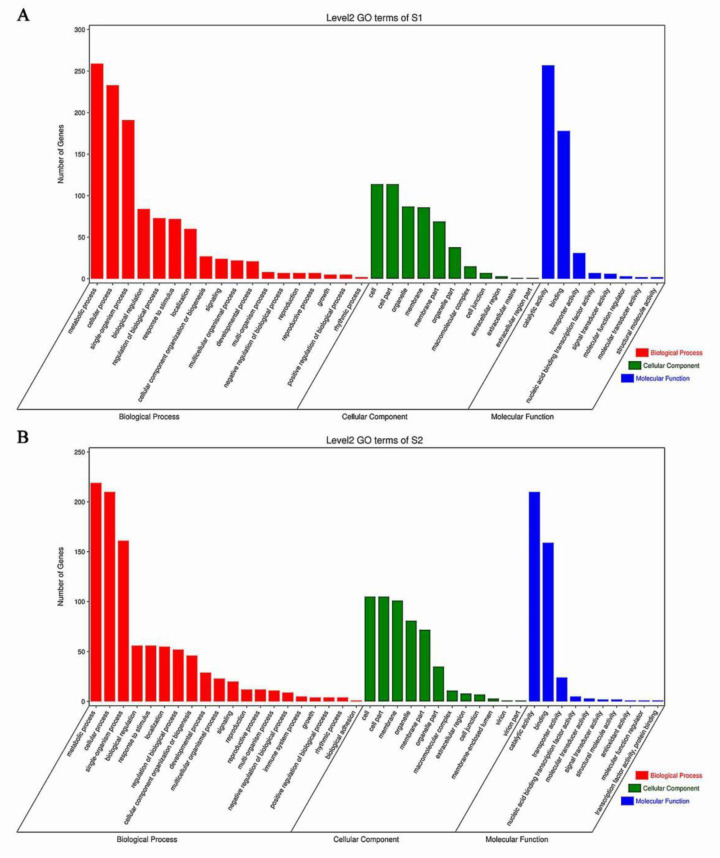
Figure 7.
GO annotation analysis of transcriptome. Statistics of the number of DEGs in 3 function categories of GO annotation in sweetpotato for (A) 90 d and (B) 130 d, respectively. The red, blue, and green columns represent the terms of biological process, cellular component, and molecular function, respectively.

