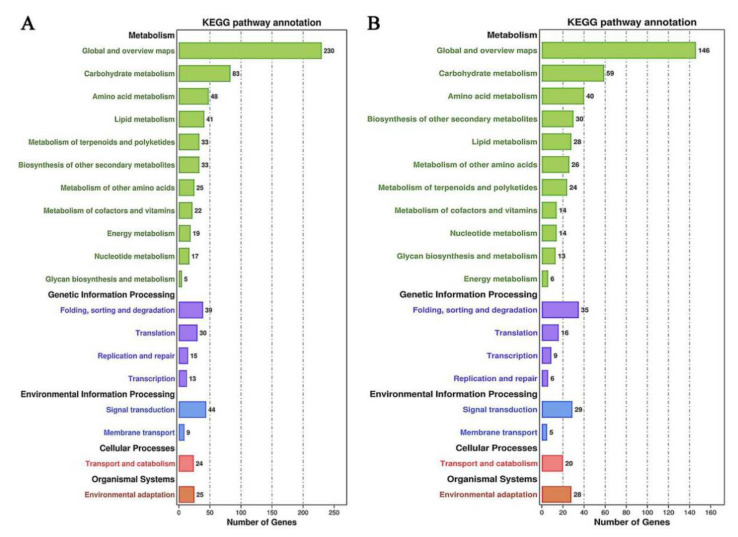
Figure 8.
KEGG pathway analysis of transcriptome. The statistics of the number of DEGs in different metabolic pathways were obtained by KEGG enrichment analysis in sweetpotato for (A) 90 d and (B) 130 d, respectively. The number marked on the column was the number of DEGs enriched in this metabolic pathway.

