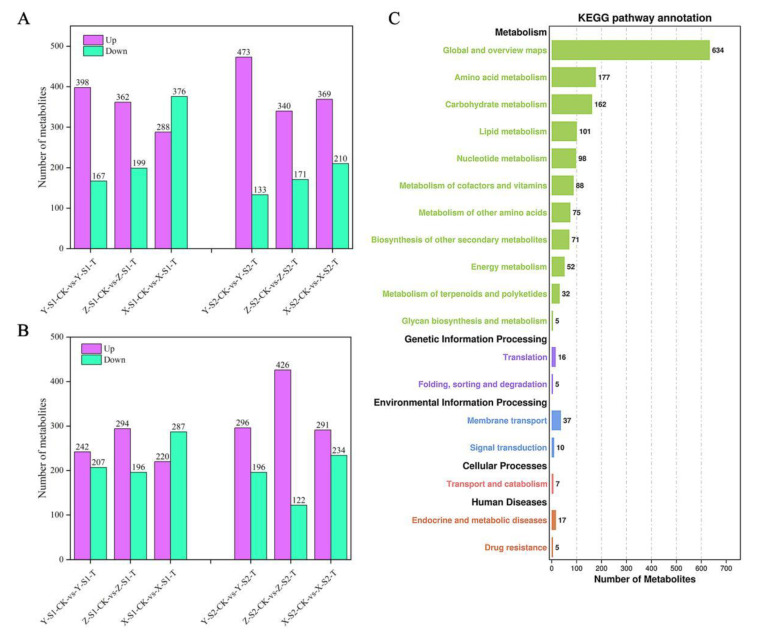
Figure 9.
Quantitative statistics of DAMs and their enrichment in different metabolic pathways. (A,B)The number of DAMs in positive and negative channel, respectively. The six columns on the left are the statistical results of S1 DAMs in the S1 growth period, and the six columns on the right are the statistical results of S2 growth period. The purple column is the number of metabolites with up-regulated abundance, and the green column is the statistics of the number of metabolites with down-regulated abundance; (C) The number of DAMs in different metabolic pathways by KEEG enrichment analysis. The number marked on the column was the number of DAMs enriched in this metabolic pathway.

