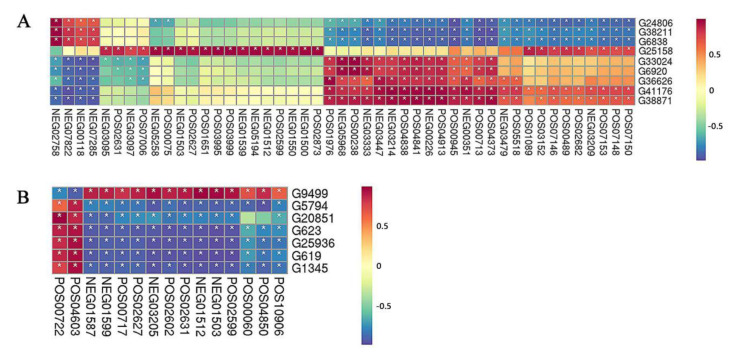
Figure 11.
Correlation analysis of DEGs and DAMs. The analysis results of sweetpotato at the growth stages (A) S1 and (B) S2, respectively. The * marked in the figure represented a significant correlation between DEGs and DAMs. The redder the color, the more significant the positive correlation and the bluer the color, the more significant the negative correlation.

