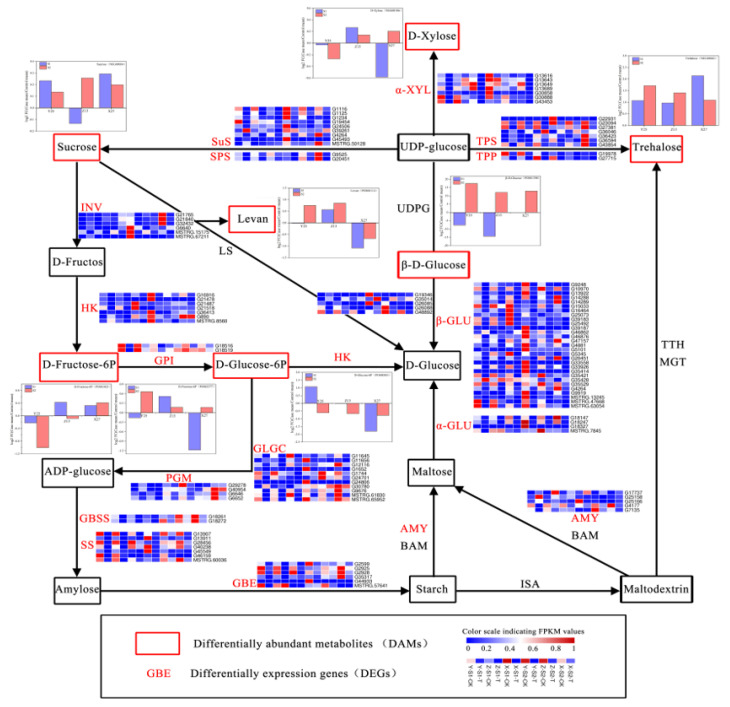
Figure 12.
Starch and sucrose metabolic pathways which enriched by DEGs and DAMs. The red font marked gene in the picture represents the DEGs enriched by the transcriptome, and the heat map next to them shows the expression of three sweetpotato varieties in S1 and S2. The metabolites marked in the red box represented the DAMs enriched by the metabolites determined by the metabolome, and the bar chart next to them shows the multiple differences between the treated and CK samples of three sweetpotato varieties in S1 and S2 periods.

