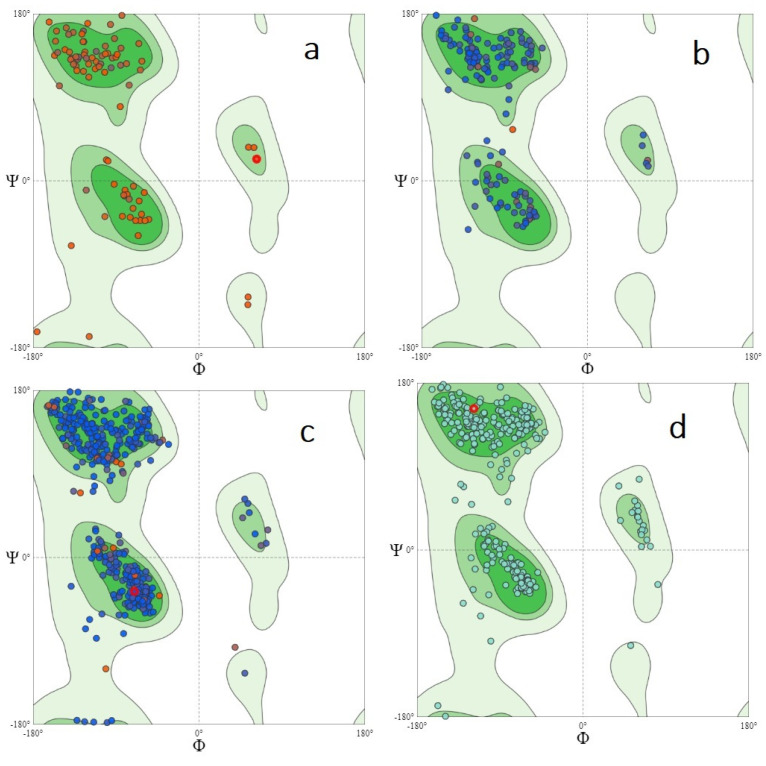
Figure A1.
Ramachandran plot of the modeled structures. Ramachandran plot of the modeled structures: (a) membrane protease; (b) spike receptor-binding domain; (c) nonstructural protein 14; (d) transmembrane protease, serine 2.  General glycine/pre-proline/proline favoured regions;
  General glycine/pre-proline/proline allowed regions;
  Glycine favoured regions;
  Glycine allowed regions.

