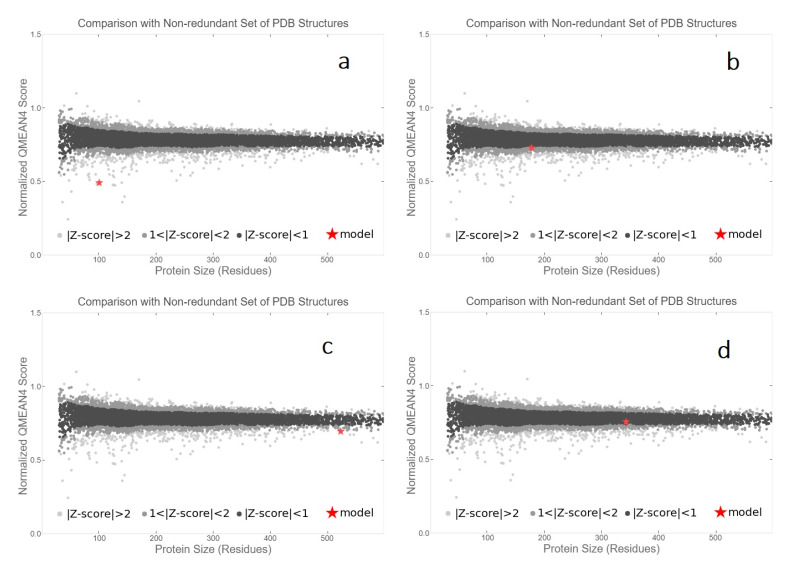
Figure A2.
Comparison of the modeled structures to the set of non-redundant crystallographic proteins in the Protein Data Bank: (a) membrane protease; (b) spike receptor-binding domain; (c) nonstructural protein 14; (d) transmembrane protease, serine 2. The plots demonstrate that the model quality scores of the individual models are comparable with scores attained for experimental structures of similar size. The x-axis represents the number of residues in the protein; the y-axis represents the QMEAN score. Each dot indicates a single experimental protein structure. Normalized QMEAN scores within 1 standard deviation of mean, Z score (0 to 1), are shown in black dots, those with a Z score between 1 and 2 in grey, and those with a Z score above 2 in light grey, while the actual model is represented as a red star.

