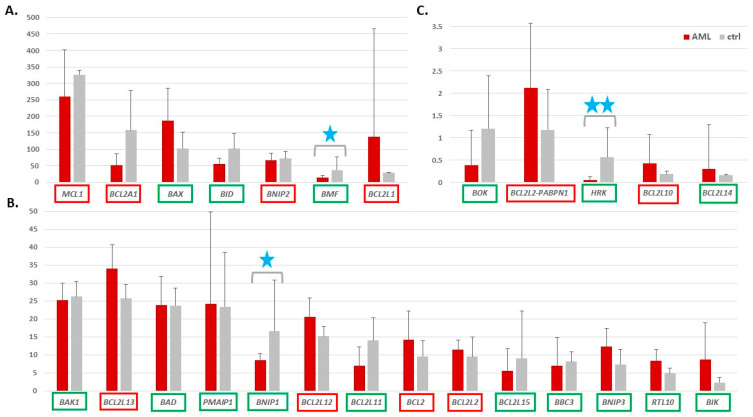
Figure 1.
Expression levels of 26 genes from the BCL2 family in AML versus control (ctrl) samples. The expression levels were extracted from the RNA-seq data and presented as mean TPM (transcripts per million) values with standard deviation bars (y axis). For clarity, the genes were ranked according to the TPM in control samples and divided into three separate graphs, from (A) the highest to (B) middle and (C) the lowest gene expression. The genes encoding the pro-apoptotic proteins are indicated in green, the anti-apoptotic are in red frames. Blue stars indicate genes with statistically significant expression change between AML and ctrl (adj. p value threshold 0.05; 1 star < 0.01; 2 stars < 0.001). The statistical data were calculated with DESeq2, which was applied for differential analysis of the whole RNA-seq data set, with a default method for multiple testing correction.

