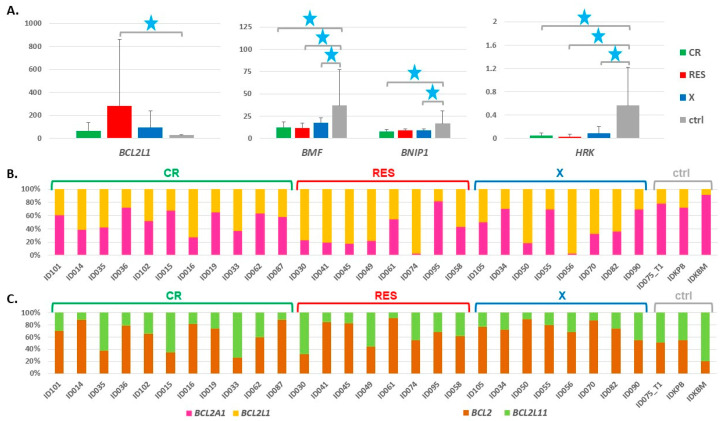
Figure 2.
(A) Expression levels of four genes from the BCL2 family in AML and ctrl samples, with AML divided into three groups according to patient response to the first induction therapy (CR—complete remission; RES—resistance to therapy; X—death during therapy). The expression levels were extracted from the RNA-seq data collected at the time of diagnosis (before treatment) and presented as mean TPM (transcripts per million) values with standard deviation bars (y axis). Blue stars indicate statistically significant expression changes (adj. p value threshold 0.05; 1 star < 0.05). The statistical data was calculated with DESeq2, which was applied for differential analysis of the whole RNA-seq data set, with a default method for multiple testing correction. (B,C) Ratio of the expression of two pairs of genes: BCL2A1 and BCL2L1 (B); BCL2 and BCL2L11 (C) in individual AML and ctrl samples, presented as a percentage contribution of each gene into the sum of TPMs of both compared genes.

