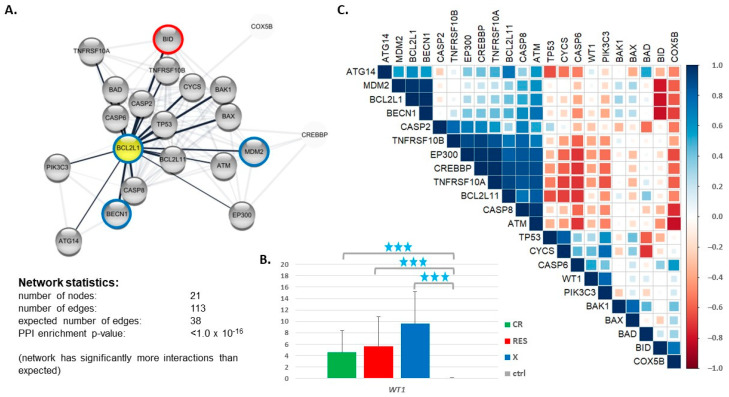
Figure 4.
The expression of genes encoding proteins interacting with BCL2L1. (A) The network of 20 proteins interacting with BCL2L1 generated by STRING (https://string-db.org accessed on 7 March 2021); (B) WT1 gene expression in AML (divided into CR, RES and X groups) and ctrl, extracted from the RNA-seq data; (C) a graphical presentation of Spearman correlation of expression calculated for each pair of the genes encoding proteins interacting with BCL2L1, based on the RNA-seq data collected for RES AML patients. The color intensity and size of the squares are proportional to the correlation coefficients. The colored circles on the plot (A) indicate proteins encoded by the genes whose expression was significantly (p > 0.05) correlated with the expression of BCL2L1, blue circles mean a positive correlation and red—a negative one.

