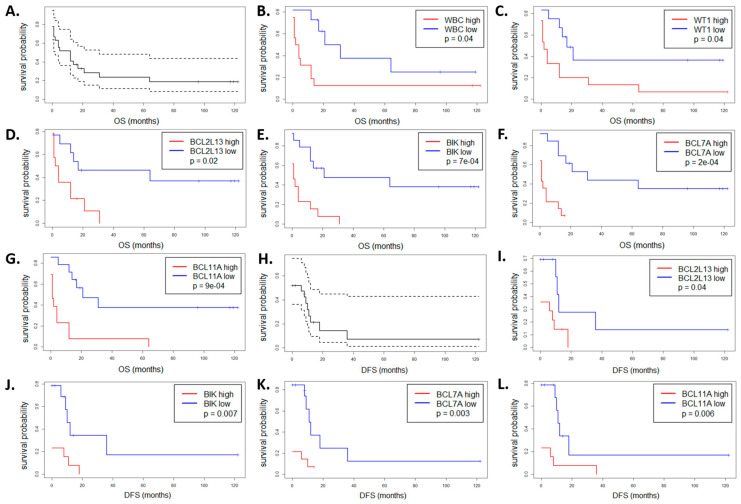
Figure 5.
Overall survival (OS, A–G) and disease-free survival (DFS, H–L) of 27 AML patients as a whole group (A,H) and divided according to the WBC count (B) or the expression level of the following genes: WT1 (C); BCL2L13 (D,I); BIK (E,J); BCL7A (F,K); BCL11A (G,L). In each case, the blue curve means low level and the red curve high level of expression. Only the genes with statistically significant differences between the two curves are shown (the log-rank test p value threshold 0.05).

