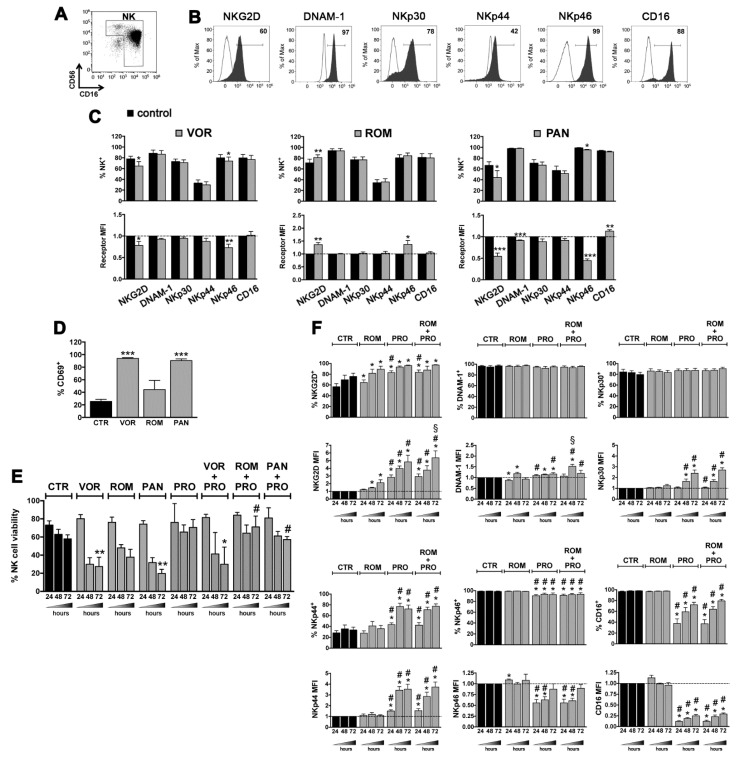
Figure 4.
LRAs effects on NK-cell viability and phenotype. (A–D) NK cells, which include CD56brightCD16+/− and CD56dimCD16+ cells, were isolated by negative selection from PBMCs of healthy donors reaching ~95% purity as shown in a representative flow cytometry analysis (A). Purified NK cells were cultured in medium alone (control, CTR) or supplemented with 334 nM VOR, 10 nM ROM, 20 nM PAN, 5 nM BOR for 24 h, then cells were analyzed by flow cytometry to measure the expression of various NK-cell markers. (B) The percentage of NKG2D+, DNAM-1+, NKp30+, NKp44+, NKp46+, and CD16+ cells among control NK cells is shown (filled gray histograms) together with control IgG signal (open histograms) for a representative experiment. (C) For each receptor, the frequency of positive cells and MFI (relatively to control MFI set to 1) was measured and mean ± SEM of at least 4 independent experiments is shown. (D) After 24 h of drug exposure, the percentage of CD69+ NK cells was evaluated in 4 donors (mean ± SEM). (E) Purified NK cells were cultivated in the presence of VOR, ROM, PAN, or PRO (1 µM) and with combinations of each HDACi with PRO. The NK-cell viability was examined at 24, 48, and 72 h by LIVE/DEAD staining. Bars represent mean ± SEM obtained from at least 3 independent donors. (F) Purified NK cells were treated with ROM and PRO, either alone or in combination, and analyzed after 24, 48, and 72 h for the expression of NK-cell receptors as described in panel (C). Bars show mean ± SEM (n = 6). Statistics was performed using paired Wilcoxon and t-test for non parametric and parametric distributions, respectively. Versus control (CTR): * p < 0.05; ** p < 0.01; *** p < 0.001. Versus ROM alone: # p < 0.05. Versus PRO alone: § p < 0.05.

