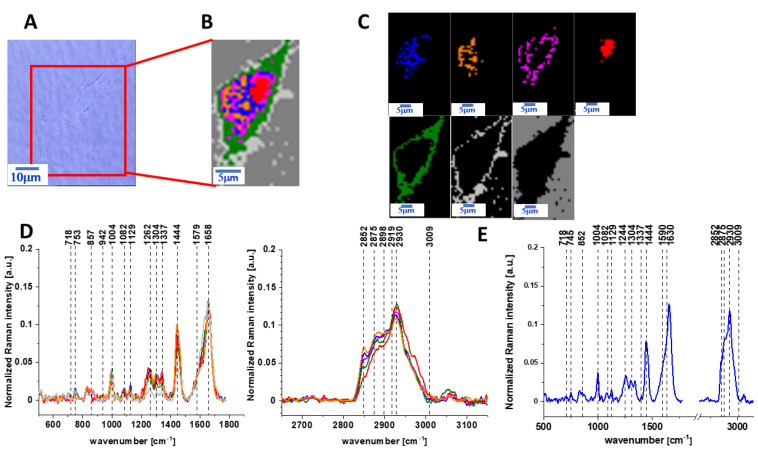
Figure 3.
The microscopy image (A), Raman image (B) of human colon normal single cell CCD-18 Co after 48 h of vitamin C supplementation constructed based on cluster analysis (CA) method; Raman images of all clusters identified by CA assigned to lipid-rich regions (blue and orange), mitochondria (magenta), nucleus (red), cytoplasm (green), cell membrane (light grey), and cell environment (dark grey) (C); the average Raman spectra typical for CCD-18 Co human normal colon cell for all identified clusters for low frequency and high frequency region (D), and the average Raman spectrum for human normal colon cells—for cells as a whole (E), cells measured in PBS, colors of the spectra correspond to the colors of clusters; excitation laser line 532 nm; number of cells = 6.

