Figure 8.
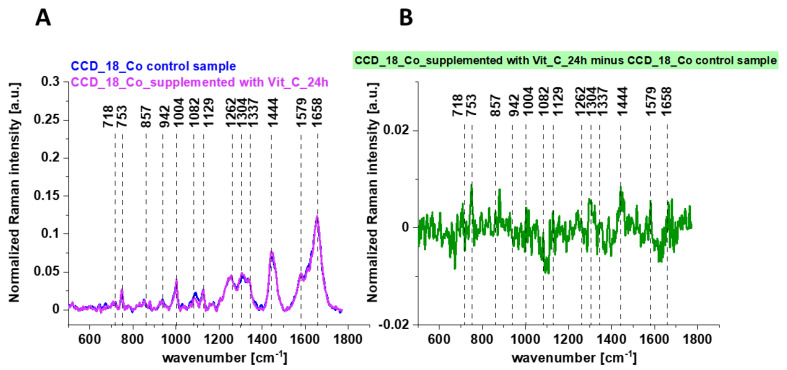
The average Raman spectra obtained for CCD-18 Co human normal control cells (control sample), the average Raman spectra typical for CCD-18 Co human normal control cells supplemented with vitamin C for 24 h (A) and the differential Raman spectrum (B) calculated based on spectra presented on panel (A); excitation laser line 532 nm; number of cells = 6 for each type.

