Figure 6.
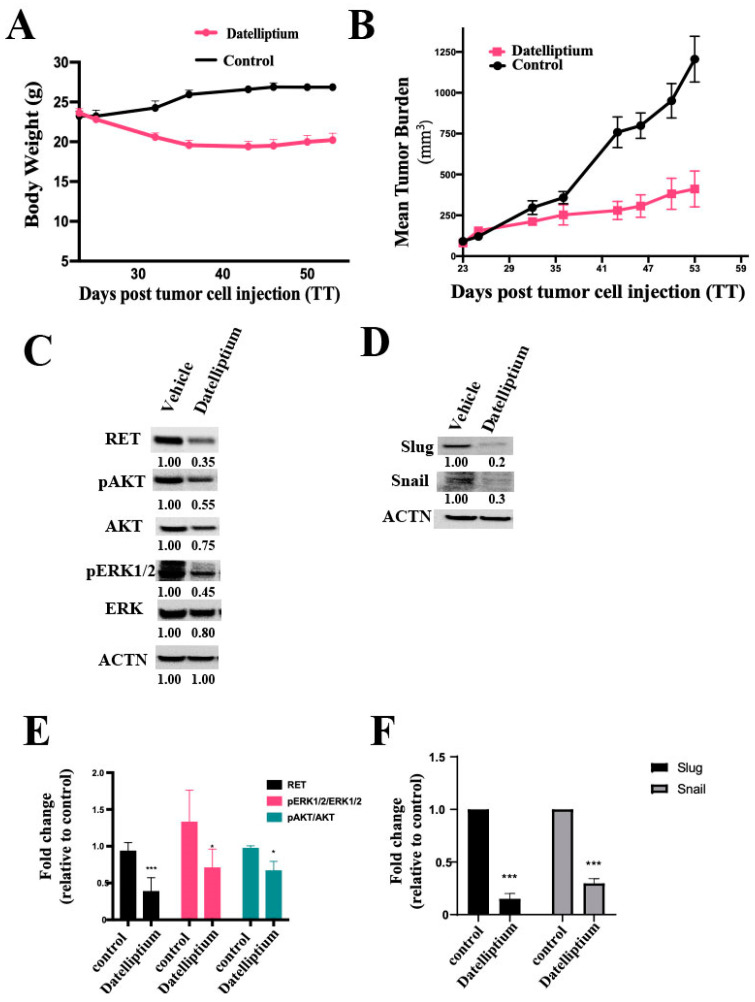
Effect of datelliptium on medullary thyroid tumor growth in vivo. (A) Average weight of mice in the control group and datelliptium (6 mg/kg) treated group; x- and y-axes illustrate days post-treatment and the average weight of mice, respectively. (B) MTC tumor growth curves of the vehicle treated group and datelliptium (6 mg/kg) treated group; x-axes and y-axes represent the number of days after drug administration and the average tumor volume, respectively. Data are mean ± SEM of 6 different mice. (C) Western blot analysis to evaluate RET, AKT, pAKT, pERK1/2, ERK1/2, and actin expression of the tumor tissues post-treatment. (D) Western blot analysis to selected EMT biomarker Slug and Snail. (E,F) Densitometry analysis of (C,D), respectively. All proteins were normalized to their basal expression (n = 3, *** p < 0.001, and * p ≤ 0.5).

