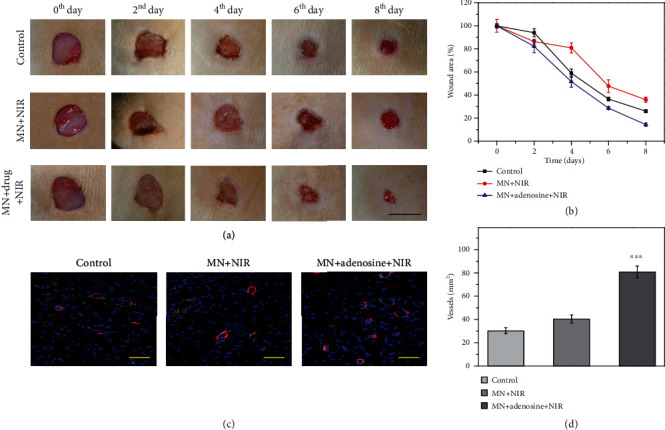
Figure 6.

Wound healing characterization. (a) Representative images showing the wound healing process in different groups: control group, MN+NIR group, and MN+adenosine+NIR group, respectively. (b) Quantitative analysis of wound area in recovery process. (c) Immunofluorescence staining showing the neovascularization situation. CD31+ structures (green) were surrounded by α-smooth muscle actin-positive cells (red), indicating the formation of vascular ducts. (d) Quantification of vascular structures. The scale bars are 1 cm in (a) and 50 μm in (c). ∗∗∗p < 0.001 when compared with the control group and MN+NIR group.
