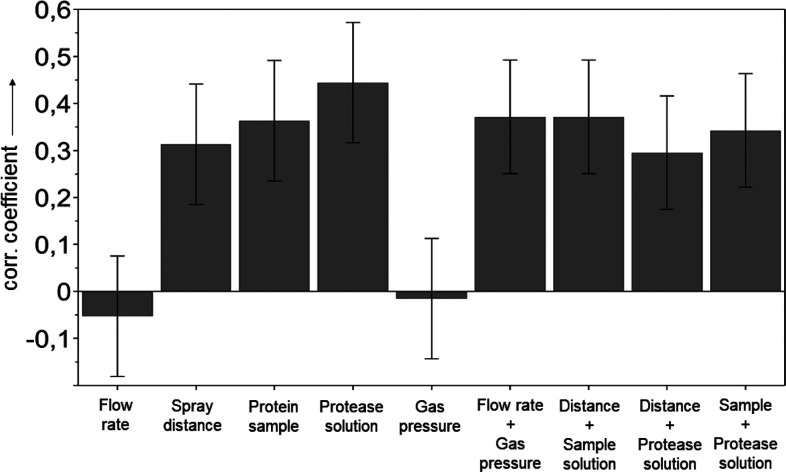
Figure 3.
DoE screening results. Normalized coefficients plot for the output variable sequence coverage obtained by an analysis of 19 randomized DoE runs (R2 = 0.97, N = 19, DF = 9, 95% confidence). For further details, see the Experimental Section as well as the Supporting Information (Tables S3 and S4).

