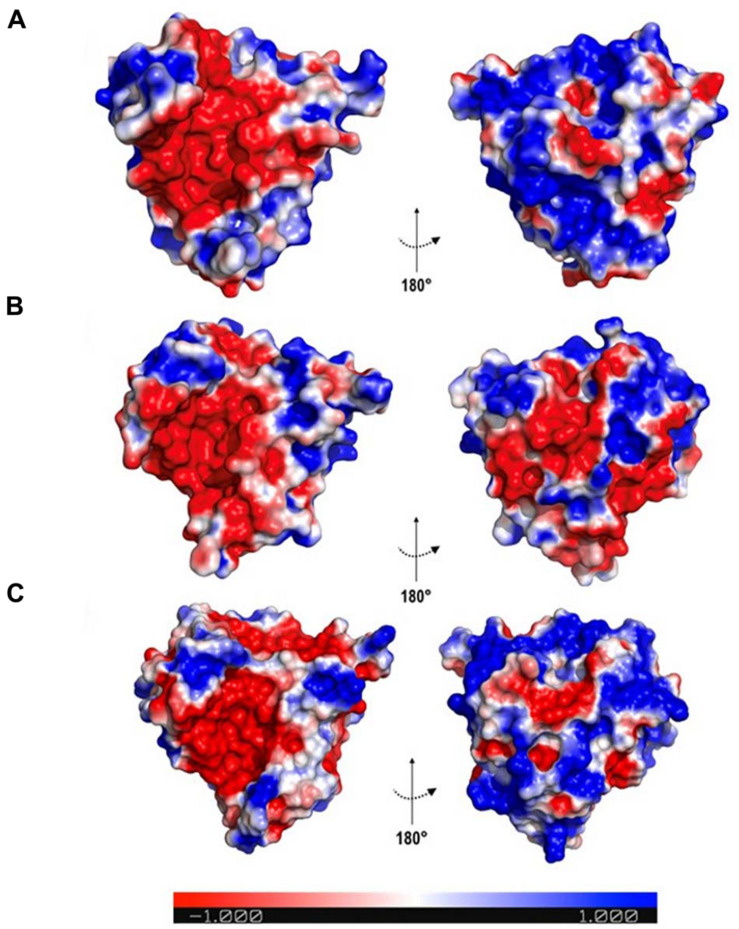
FIGURE 4.
Electrostatic surface potential of osmotin proteins. The colours indicate charges in the electrostatic surface potential; where red, blue, and white represent negative, positive, and neutral regions, respectively. (A) Sni_SnOLP image representing the electrostatic surface potential of Solanum nigrum and Nicotiana tabacum osmotins. (B) Gma_OLPb image representing the electrostatic surface potential of Glycine max osmotins, except Gm_P21-like. (C) Gma_P21-like. Images generated with PyMOL Molecular Graphics System version 1.5.0.4 (Schrödinger, LLC).

