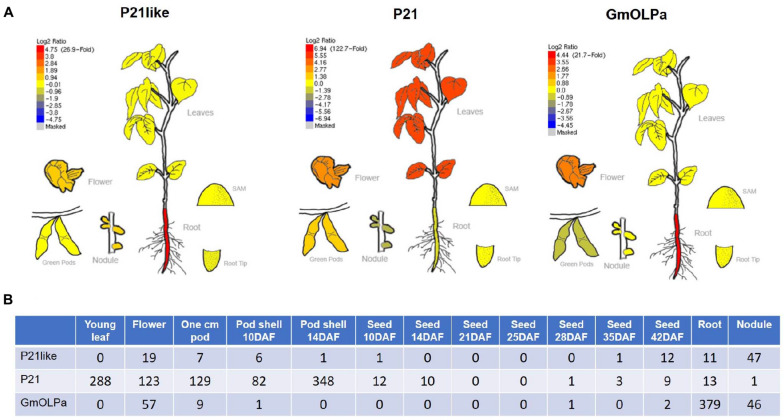
FIGURE 5.
In silico gene expression analysis. (A) Relative expression profile of soybean osmotin genes from the RNA-seq BAR database (http://bar.utoronto.ca/efpsoybean/cgi-bin/efpWeb.cgi) (Libault et al., 2010). Red and blue colours indicate upregulated and downregulated genes, respectively (Log2 ratio) in different organs/tissues as plotted in the bar scale. (B) Digital gene expression counts of the uniquely mappable reads from RNA-Seq Atlas of Glycine max raw data (Severin et al., 2010). RNA-seq reads were only mapped to the initial genome assembly (i.e., Wm82.a1.v1).

