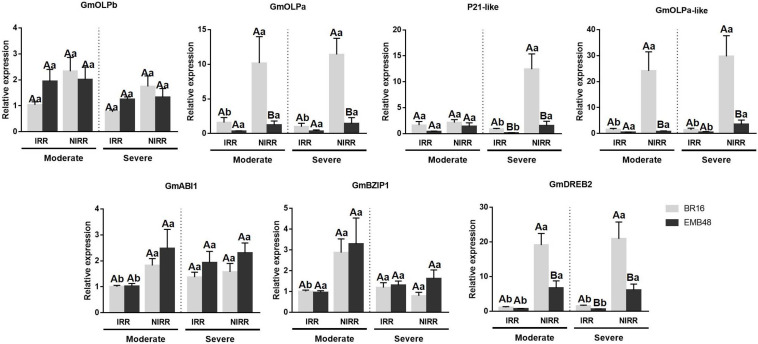
FIGURE 6.
Gene expression analyses in a greenhouse experiment involving plants at the R1 development stage submitted to moderate and severe stress. The relative expression levels of soybean osmotin genes (GmOLPb, GmOLPa, P21-like and GmOLPa-like) and ABA response markers (GmABI1, GmBZIP1, and GmDREB2) in leaves were measured by RT-qPCR. NIRR, non-irrigated plants. Irrigated (IRR) plants of each cultivar were used as control. CYP2 and ELF1A reference genes were used as internal controls to normalise the amount of mRNA present in each sample. All transcript levels were calibrated in relation to the expression level of BR16 IRR plants under moderate water stress. Data represent the means of four biological replicates with three technical replicates each. Capital letters correspond to the comparison among means of cultivars within the same treatment. Small letters correspond to the comparison among means of treatments within the same cultivar. Means labelled with the same letter do not differ significantly (Duncan’s test, p < 0.05). Error bars represent the standard error of the mean.

