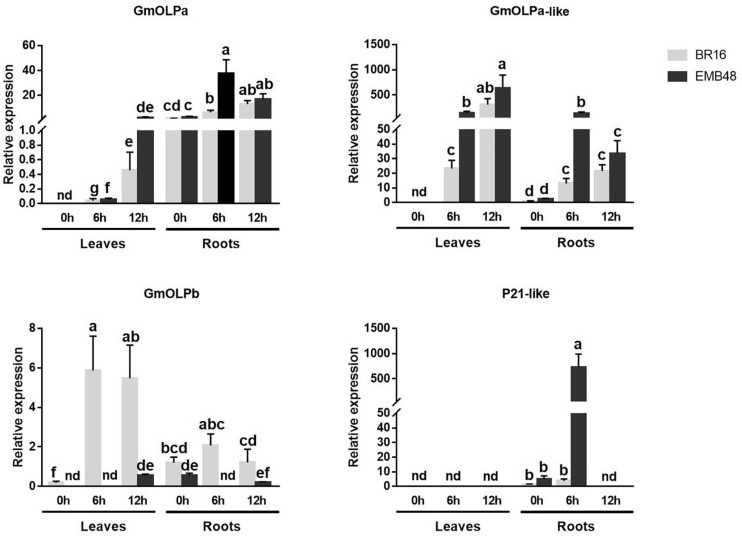
FIGURE 7.
Gene expression analyses in a growth chamber experiment of plants at the V3 development stage submitted to drought stress. The relative expression levels of genes in leaves and roots were measured by RT-qPCR at 0 (control), 6, and 12 h after dehydration treatment. CYP2 and ELF1A reference genes were used as internal controls to normalise the amount of mRNA present in each sample. All transcript levels were calibrated in relation to the expression level of BR16 roots at 0h. Data represent the means of five biological replicates with three technical replicates each. Means labelled with the same letter do not differ significantly (Duncan’s test, p < 0.05). Error bars represent the standard error of the mean. Nd, not detected.

