
TABLE 3.
Microarray and RNA-seq data from soybean submitted to drought stress experiments.
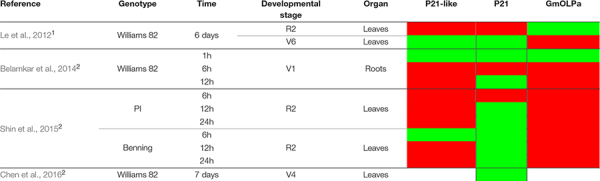 |
1Microarray analysis.
2RNA-seq analysis.
Red and green rectangles indicate upregulation and downregulation, respectively.
Official websites use .gov
A
.gov website belongs to an official
government organization in the United States.
Secure .gov websites use HTTPS
A lock (
) or https:// means you've safely
connected to the .gov website. Share sensitive
information only on official, secure websites.
Microarray and RNA-seq data from soybean submitted to drought stress experiments.
|
1Microarray analysis.
2RNA-seq analysis.
Red and green rectangles indicate upregulation and downregulation, respectively.