FIGURE 2.
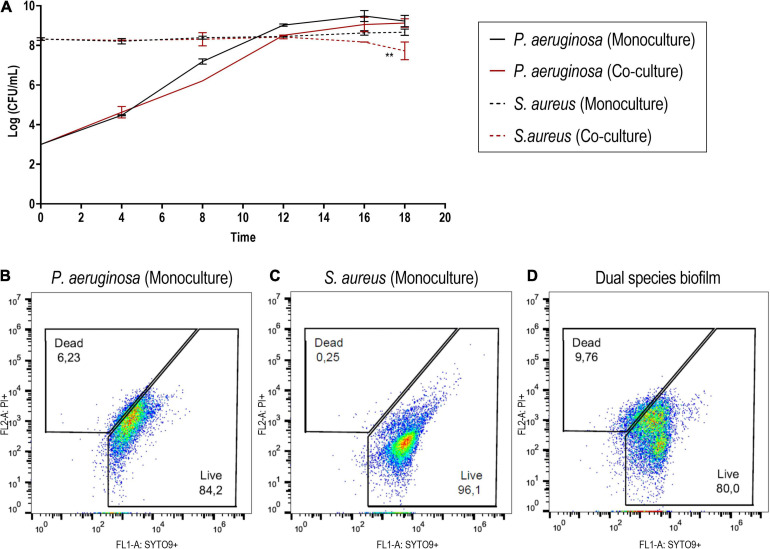
(A) Monitoring of the bacterial density of Staphylococcus aureus ATCC 25923 and Pseudomonas aeruginosa PAO1 in mono- and co-cultured biofilms at different time points. (B–D) Cytographs corresponding to cells recovered from the biofilm formed by P. aeruginosa (B) and S. aureus (C) in monoculture and the dual-species biofilm (D). SYTO 9 was used to stain viable cells, while PI was utilized to stain cells with disrupted cell membrane integrity. The results are expressed as the mean of at least two biological repetitions with their ± SD. Statistical differences were assessed by comparing the mono- and co-cultured biofilms of each bacterial species (Student’s t-test, ∗∗p < 0.01).

